
Methodology
The sun, and how it impacts our weather
The world’s weather is very much influenced by the activities of the stellar hydrogen fusion reactor that we call the “sun”. The primary process which powers the sun is the fusion of Hydrogen gas to form Helium, with the subsequent release of vast amounts of energy.
The interior of the sun is estimated to be several million Degrees Celsius, with surface temperatures around 6,000 Degrees. This star has a mass 322,946 times greater than Earth and a mean equatorial diameter of 1,392,000 km compared to the 12,756 km diameter of Earth. Even though it is located at a mean distance of some 149,600,000 kms from Earth, it is our primary source of life and energy.
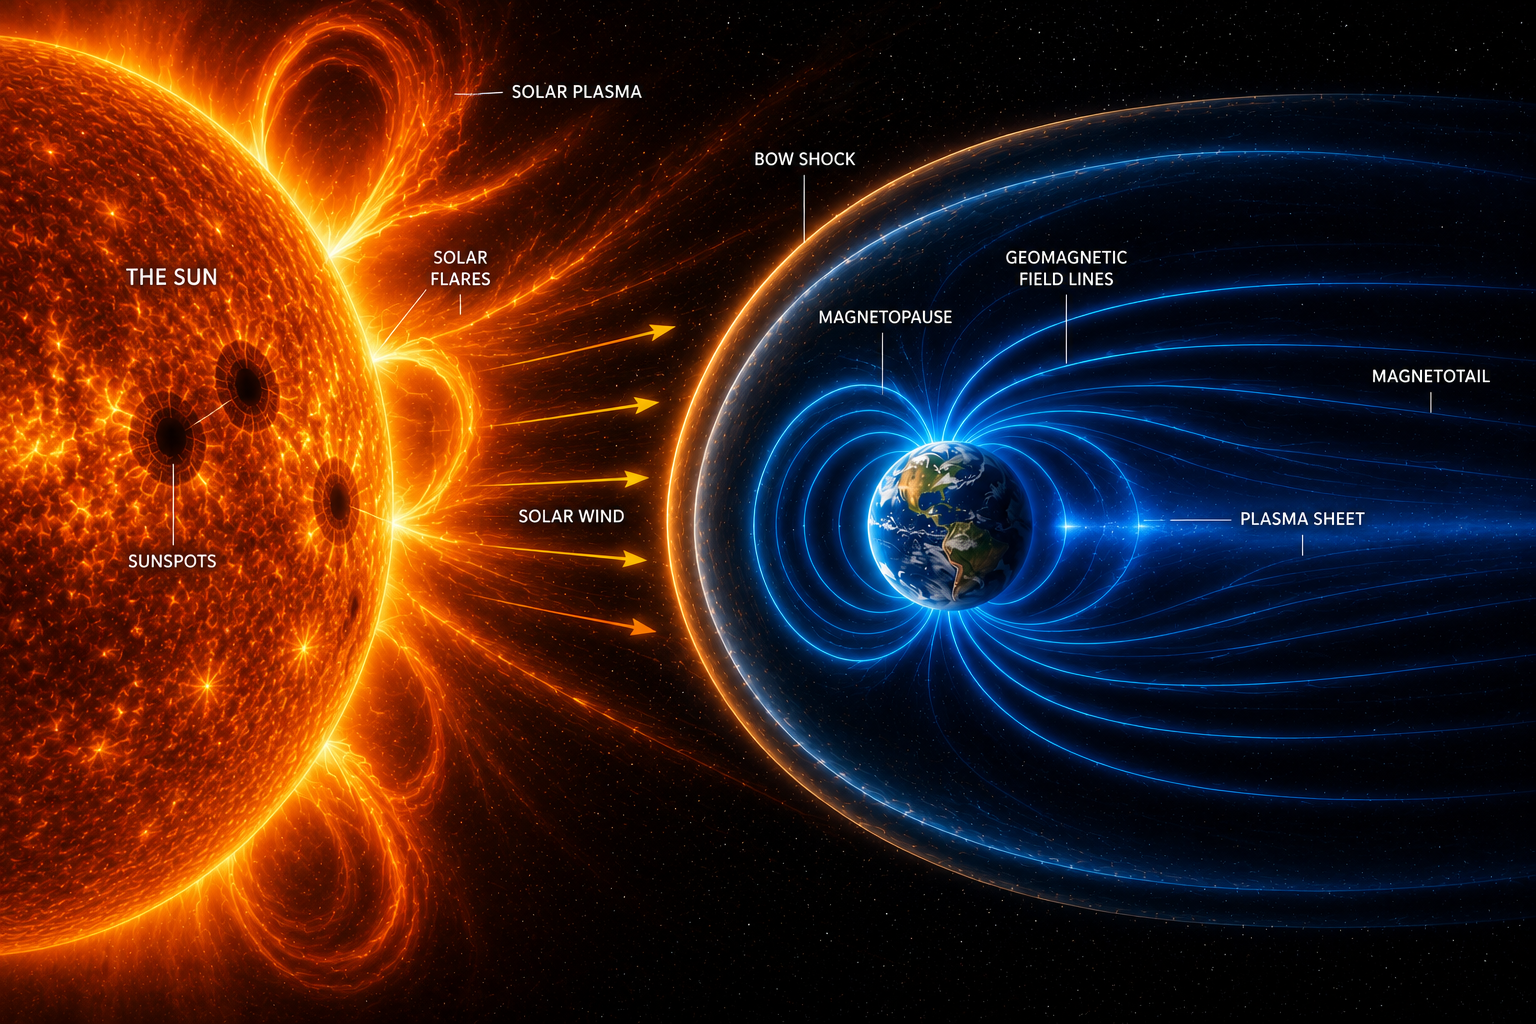
The sun’s corona and huge solar flares, which project 100s of thousands of kms from the sun’s surface, are clearly visible in the image above. The bright yellow areas on the surface of the sun are violent vortices of boiling superheated gases commonly known as “sunspots”. The lighter areas are the sun’s corona of plasma clouds which stream into space, focused and further energised by the sun’s magnetic fields. These solar winds have a profound influence on the world’s radio transmissions and weather because of the high-energy charged particles bombarding the Earth, causing ionisation of the upper layers of the atmosphere, polar auroras, significant distortion of the Earth’s magnetic fields, and a charged particle “tail” which extends into deep space on the shadow side of the Earth.
These distortions can be seen in the image above. The Earth is the small sphere near the centre of the image, and the distorted geomagnetic fields are shown as the “waves” of pale blue. All of these effects interact with each other, as well as more localised surface phenomena, to form our weather, and we integrate and analyse this information to create our forecasts.